Assignment #4 C S C
1 0 1 Due Date:
Mohammadi 45 Points
Objectives
Learn to use MS_Excel'2002 in practical
contexts.
Build a spreadsheet of your grades.
Create a
spreadsheet in Excel that will enable you to keep track of your progress in our
course. Here is the information that you need to keep.
|
Labs |
Exams |
||||
|
Lab#
|
Max |
Actual |
Exam#
|
Max |
Actual |
|
1 |
25 |
XX |
1 |
50 |
XX |
|
2 |
25 |
XX |
2 |
|
|
|
3 |
25 |
XX |
3 |
|
|
|
4 |
25 |
XX |
|
|
|
|
5 |
25 |
XX |
|
|
|
|
6 |
25 |
XX |
|
|
|
|
7 |
25 |
XX |
|
|
|
|
8 |
|
|
|
|
|
|
9 |
|
|
|
|
|
|
10 |
|
|
|
|
|
|
Total |
XXX |
XXX |
|
XXX |
XXX |
|
|
|
|
|
|
|
|
Assignments |
|||||
|
Assignment# |
Max |
Actual |
|
|
|
|
1 |
30 |
XX |
|
|
|
|
2 |
60 |
XX |
|
|
|
|
3 |
|
|
|
|
|
|
4 |
|
|
|
|
|
|
5 |
|
|
|
|
|
|
6 |
|
|
|
|
|
|
Total |
XXX |
XXX |
|
|
|
|
|
|
|
|
|
|
|
Overall
Percentage: |
XX.X% |
||||
|
Letter
Grade: |
XX |
||||
You must use the S function for the totals in this worksheet. The formula that yields your current overall
percentage is as follows, obviously, you need to reference the correct cell
numbers for the totals to implement this formula correctly (for example, if Lab
Max Total is in B13, you need use it in the formula for the Overall Percentage
where appropriate):
= ((Lab Actual Total / Lab Max
Total)*.25) +
((Exam Actual Total / Exam Max
Total)*.40) +
((Assignment Actual Total /
Assignment Max Total)*.35)
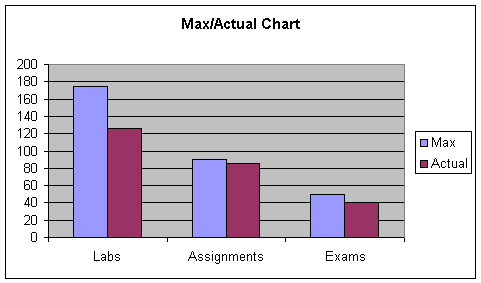
Max/Actual
Chart
Generate the chart below showing how well you are doing in each of the categories.
You will need to first build a summary report for the max/actual totals of each category (i.e. labs, assignments, exams); the steps will be similar to the ones you followed for lab#8.
This chart is generated based on the aforementioned Summary Report.
What to hand in?
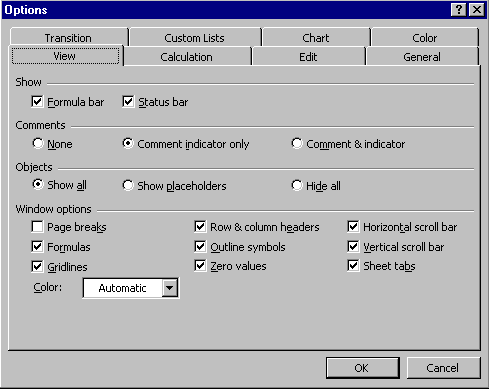
Produce two printouts, one regular printout and another with formulas showing; as well as, another printout of the chart above. To see the formulas you have to check the Formulas choice box in Options. "Options" is found under the Tools pull-down menu. Make sure you click the View tab and the following should be what you see:
Letter
Grade (5 Points Extra Credit)
To have Excel produce a letter grade for your, you need the @if function. Two cells need to be dedicated to the @if function, as there is a limit on nesting ifs in Excel. The formula printout described above must include these cells. The following table provides you with the categories:
|
|
A = 93-100% |
A- = 90-92% |
|
B+ = 87-89% |
B = 83-86% |
B- = 80-82% |
|
C+ = 77-79% |
C = 73-76% |
C- = 70-72% |
|
D+ = 67-69% |
D = 63-66% |
D- = 60-62% |
|
|
E = 0-59% |
|
The following is just an example for how you formulate
nesting of if functions. Note that the example shown below only shows
3 categories of grades; you MUST
implement all categories regardless of where your grade falls.
=if(B45>0.93,"A+",if(B45>.90,"A","C"))